
Download Annual Mailer Data Summary Table
Mailers were sent to all surviving RBS participants at approximately yearly intervals between 1982 and 2017. There are 32 mailers in all, with response rates ranging from 65% to 93%. Mailers assessed a wide variety of information that varied from year to year, with many questions repeated in multiple mailers. For example, a questionnaire was included approximately every two years to gather updated data on current health and diseases (see Health and Vital Status Follow-up). The Annual Mailer Data Summary Table provides a list of mailer topics tabulated by visit data group and by year. A section summarizing relevant mailer data is also provided within individual Visit Data Group descriptions, where appropriate.
Overall, 5822 RBS participants responded to one or more annual mailer. Of these, 25% responded to 20 or more of the mailers over the 35-year mailer period, and 600 participants completed all or almost all of the mailers (30 to 32). The median participant age at the time of their last mailer was 81 years, 843 were age 90 or older. These statistics indicate the high level of response to the RBS mailers, and the extraordinary loyalty of the participants, even into very old age. Remarkably, for 86% of deceased RBS participants, their final mailer response was received within the last 5 years of their life.
Note: Important differences in annual mailer data and research clinic visit data should be considered when using the RBS data, including:
1. Participant Characteristics: Participants in RBS research clinic visits were all community-dwelling at the time of the visit, with very few exceptions. In contrast, annual mailers were sent to all surviving RBS participants regardless of their living situation, and may include individuals living in assisted-living facilities or nursing homes. Living situation was queried every few years in the mailers beginning in 1996. During that period, only 1-3% of mailer respondents reported living in non-community settings.
2. Sample Size: The number of respondents to annual mailers is usually much larger than the number of participants at research clinic visits for several reasons. Mailers were sent to all surviving participants, while visit participants were often invited based on specific criteria (detailed under the Study Description > Research Clinic Visits tab). In addition, the burden of answering mailers was much less than that of attending research clinic visits, resulting in a higher participation rate for mailers. Finally, participants who moved from the Rancho Bernardo area were more likely to participate in follow-up mailers, than follow-up visits.
3. Data Archive: For the RBS archive, data collected at research clinic visits is organized into meaningful categories, or “data groups”. Variable names for each data group are harmonized across all visits, and are provided in longitudinal data sets including available data from all 12 visits. In contrast, mailer data are provided in an individual cross-sectional data set for each annual mailer; variable names are based on the sequence of questions for that mailer. No attempt has been made to harmonize mailer variable names; however, section headings in the mailer data dictionaries are harmonized.
Flowchart
The flowchart below indicates the timing of the annual mailers relative to the research clinic visits to facilitate effective intermingling of mailer and visit data for research purposes.
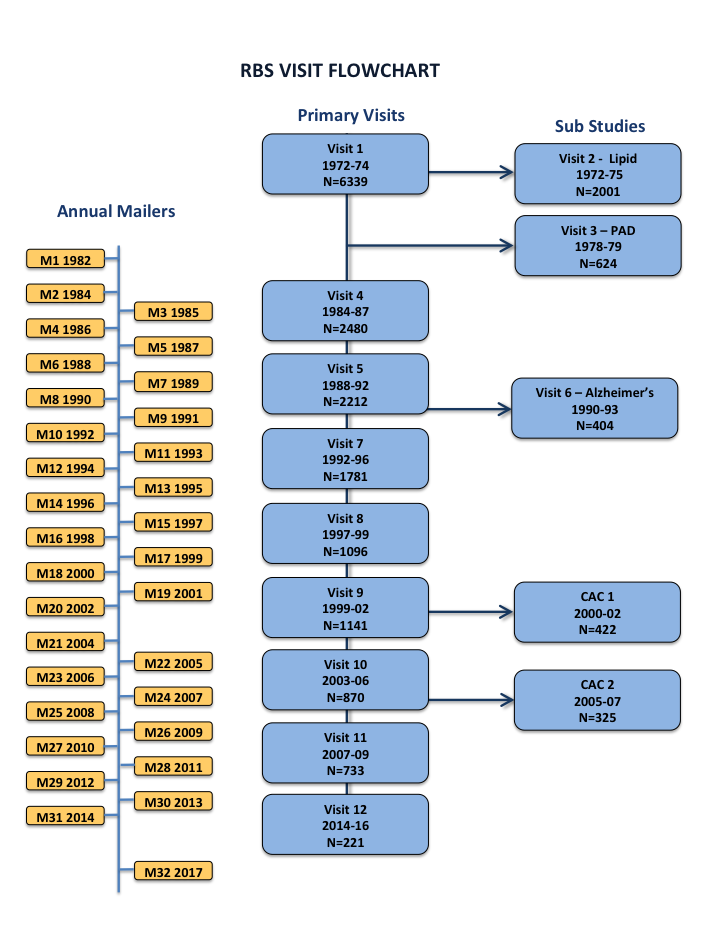
PAD=peripheral arterial disease, CAC=coronary artery calcification