
Download Clinical CVD Data Dictionary
Download Subclinical CVD Data Dictionary
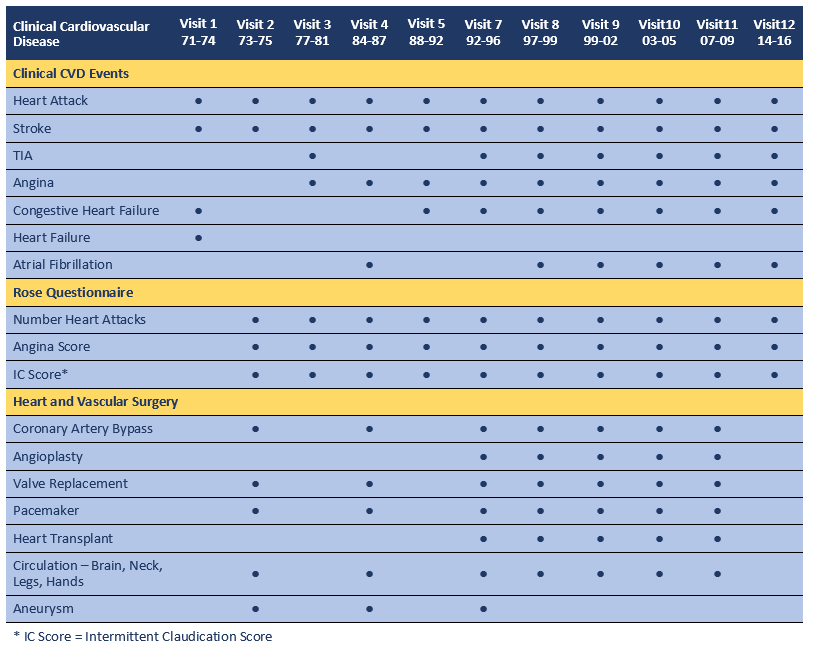
Information on Clinical Cardiovascular Disease events and surgeries was gathered by self-report at research clinic visits and via annual mailers starting in 1971 and continuing through 2018. The Rose Questionnaire was administered at Visits 2 through 12 and evaluated for angina and intermittent claudication scores. Measures of Subclinical Cardiovascular Disease were obtained at select research clinic visits beginning with Visit 3 and included carotid atherosclerosis, coronary artery calcification (measured at two time points on the same participants), and peripheral arterial disease, as well as non-invasive measures of cardiac function.
See the Labs data group for traditional and novel CVD risk factor blood measures obtained at each research clinic visit. See Physical Characteristics data group for physical measures obtained at each visit such as blood pressures, body size and body composition.
Validation of self-reported heart attack: In 1983,validation of self-reported heart attack (by chest pain, enzyme elevation, and electrocardiogram) was achieved for 72% of the 173 cases in which hospital records could be obtained. (1)
Validation of cardiovascular cause of death: In one third of the cohort, all death certificates with any mention of CVD, hypertension, or diabetes were validated by interviews with next of kin, physicians and hospital records. A mortality classification panel of cardiologists determined that these data supported the CVD diagnosis in 86% of cases reviewed. (1)
References
- Barrett-Connor E, Khaw KT. Endogenous sex hormones and cardiovascular disease in men. A prospective population-based study. Circulation. 1988;78(3):539-45. PubMed PMID: 3409497.
Subclinical Cardiovascular Disease
Several measures of cardiac function and subclinical cardiovascular disease were obtained at select visits, at times in select populations, as detailed below.
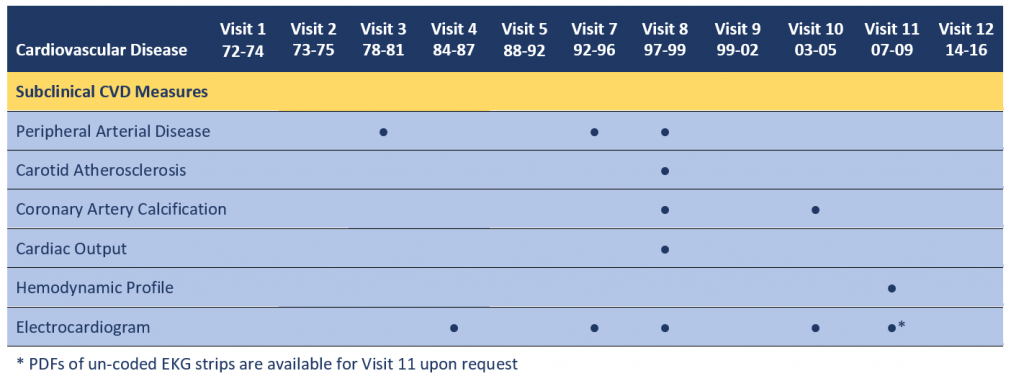
Peripheral Arterial Disease (PAD). Two assessments of PAD were performed at Visits 3, 7 and 8: the ankle brachial index (ABI) and the toe brachial index (TBI). With the participant in the supine position after 5 minutes of rest, a specially trained and certified nurse used a mercury sphygmomanometer to measure the blood pressure in each arm and leg. Systolic blood pressure of the brachial artery was used for the upper extremities, whereas duplicate systolic blood pressures of the posterior tibial artery were used for the 2 lower extremities. (At Visit 3 only one measure of the lower extremities was obtained). The ABI and TBI was calculated separately for each leg by taking the higher systolic blood pressure in each lower extremity site and dividing by the highest upper-extremity systolic blood pressure. The lowest of these two leg-specific ABIs and TBIs was used to classify the ABI and TBI score for each participant. (1)
Carotid Atherosclerosis. Carotid intima media thickness (cIMT) measurements were obtained at Visit 8. B-mode ultrasonography of the left and right common and internal carotid arteries was performed by a specially trained radiologic technician. Briefly, 4 standardized images were obtained bilaterally on each participant: 1 at a lateral angle of the common carotid artery (CCA), defined as the segment 1 cm proximal to the dilation of the carotid bulb, and 3 for the internal carotid artery (ICA) at the site of maximal thickness in three distinct angles (anterior, posterior, and lateral) from the oblique view. Ultrasound measurements were taped on super-VHS tape and sent to a central reading facility, where data were processed in a blinded fashion. Mean values were calculated for the near and far wall maximums at each site. The CCA IMT thickness was calculated as the mean of the mean measurements for the left and right CCA. Similarly, the ICA IMT thickness was determined as the mean of the 3 mean IMT measurements for the left and right ICA. (2)
Coronary Artery Calcification. Participants: At Visit 8, participants who were free of clinically manifest coronary heart disease (no physician-diagnosed angina, myocardial infarction, or coronary artery revascularization), age 55 to 80 years, and post-menopausal (at least 1 year without menses) if female, were invited to have chest and abdominal electron beam computed tomography (EBCT) scans for coronary artery calcification and visceral and subcutaneous abdominal fat mass. Of the 545 individuals who were invited, 422 individuals had baseline EBCT scans. At Visit 10, 337 of these participants returned for a repeat EBCT scan. See reference 3 for reasons for non-participation for each visit. Measurements: CAC was assessed using an Imatron C-150 ultrafast CT scanner (Imatron, San Francisco, CA). Images were obtained with 100-ms scan time using 3-mm slices starting at the level of the carina and proceeding to the level of the diaphragm; 40–45 slices were obtained. Tomographic imaging was electrocardiographically triggered to the R-R interval, and images were obtained at end-diastole during a single breath hold. CAC was scored according to the Agatston method. (2,3)
Cardiac Output. At Visit 8, cardiac output was evaluated by thoracic electrical bioimpedance (TEB) cardiography. (TEBCO, Hemo Sapiens, Inc., Sedona, AZ). The TEBCO measures continuously and noninvasively 10 cardiodynamic parameters including cardiac index, stroke index, ejection phase contractility index, and ventricular ejection time (see data dictionary for details). [Note: As of Mar, 2020 these RBS data have not been published.]
Hemodynamic Profile. At Visit 11, a detailed hemodynamic profile was obtained non-invasively using the Dynapulse 5200A (Pulsemetrics, San Diego, CA). Information obtained includes blood pressures, heart rate and pulse waveform, and functions of left ventricle and arterial system, such as LV contractility, cardiac output, and arterial compliance, distensibility and resistance. [Note: As of Mar, 2020 these RBS data have not been published.]
Electrocardiogram. A standard 12-lead resting EKG/ECG was performed at Visits 4, 7, 8 and 10 by trained personnel according to the 1982 Minnesota protocol. Readings were sent to the Minnesota Coding Center for standardized interpretation according to the Minnesota Code criteria. EKGs were also obtained for most participants at Visit 11, but have not been coded. PDFs of these EKG strips are available by request (ranchobernardostudy@health.ucsd.edu) to investigators desiring to code them for their own use and to contribute to the RBS Archive. (4,5)
References
- Allison MA, Laughlin GA, Barrett-Connor E. Association between the ankle-brachial index and carotid intimal medial thickness in the Rancho Bernardo Study. Am J Cardiol. 98(8):1105-9. 2006.
- Larsen BA, Laughlin GA, Cummins K, Barrett-Connor E, Wassel CL. Adipokines and severity and progression of coronary artery calcium: Findings from the Rancho Bernardo Study. Atherosclerosis. 265:1-6. 2017.
- Agatston AS, Janowitz WR, Hildner FJ, Zusmer NR, Viamonte M, Jr, Detrano R. Quantification of coronary artery calcium using ultrafast computed tomography. J Am Coll Cardiol. 15:827–832, 1990.
- Scheidt-Nave C, Barrett-Connor E, Wingard DL. Resting electrocardiographic abnormalities suggestive of asymptomatic ischemic heart disease associated with non-insulin-dependent diabetes mellitus in a defined population. Circulation. 81(3):899-906. 1990.
- Rose GA, Blackburn H, Gillum RF, Prineas RJ. Cardiovascular Survey Methods, ed 2. Geneva, World Health Organization, pp 123-129. 1982.