
Download Psychosocial Factors Data Dictionary
At each visit, participants were sent a detailed questionnaire to complete at home; answers were reviewed for completeness during the clinic visit. The questionnaires included a variety of of questions about living situation, social engagement, mood, and personality traits, which varied across visits.
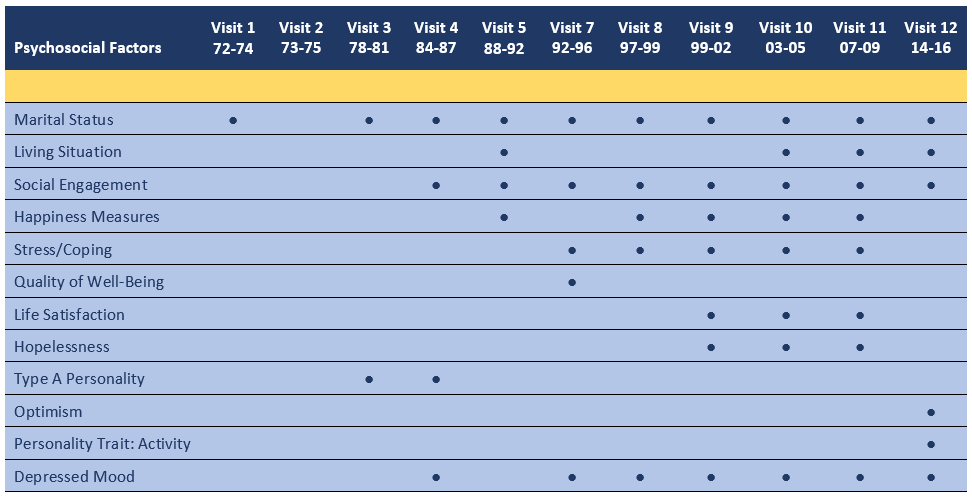
Marital Status. Participants were asked if they were currently married, separated, divorced, widowed or single. At Visit 11 they were also asked how many years they were married, divorced, or widowed, and whether they acted as a caregiver in the home.
Living situation. Participants were asked if they lived alone, who they lived with, and type of accommodation.
Social Engagement. This questionnaire was adapted from the Berkman-Syme Social Network Index1. It asks participants to indicate number of close friends and family members, frequency of contact, and level of involvement with various social groups. Select questions were asked at different visits.
Fordyce Happiness Measures2. Participants were asked to indicate how happy or unhappy they usually felt, and to indicate, on average, the percentage of time they felt happy, unhappy, and neutral.
Stress and Coping. Participants were asked to rate their level of stress in the past year and to indicate their perceived balance between life’s demands and their resources.
Quality of Well-Being3. A health-related quality of life index which combines preference-weighted values for symptoms and functioning for four subscales: physical activity, social activity, symptoms, and mobility. On each subscale scores range from 0 – asymptomatic to 1 – fully impaired. These scores are combined into a total quality of life score, which ranges from 0.0 (death) to 1.0 (optimal functioning). This scale was administered through a structured telephone interview.
Life Satisfaction. Two life satisfaction scales were administered, the 13 item Life Satisfaction Index Z (LSIZ)4 and the 5 item Satisfaction with Life Scale (SWL)5. For the LSIZ, a response of “agree” to eight of the statements and “disagree” to the remaining five (items 3,4,5,11 and 12) indicate satisfaction. Participants received two points for each response indicating satisfaction, one point for a response of “don’t know”, and zero points for each response indicating dissatisfaction. Scores range from 0–26 with higher values indicative of greater life satisfaction. For the SWL agreement with each item indicates satisfaction. Scores range from 0 – 35 with higher values indicating greater satisfaction with life.
Hopelessness Scale6. Developed for the Kuopio Ischemic Heart Disease Risk Factor Study, this scale consists of 2 items (impossible to reach goals, feeling hopeless) with responses on a 5 point scale from absolutely agree to absolutely disagree. Items are reversed scored, and summed to create a hopelessness score ranging from 0 – 8, where higher scores represent greater feelings of hopelessness.
Type A/B Personality. The Bortner Rating Scale 7, a14-item self-administered questionnaire was used to assess Type A/B personality traits. Individuals indicated where they fell along a line separating two extreme values of a trait. Distance from the non-A end of the line was measured and is provided for each item. Total score, summed across all 14 items to yield the Pattern A score, is also provided. The higher the score, the greater the tendency toward Type A behavior.
Optimism. The 10-item Life Orientation Test –Revised (LOT-R) provides a measure of optimism and pessimism 8. Of the 10 items, 3 measure optimism (#1,4,10), 3 measure pessimism (#3,7,9) and 4 (#2,5,6,8) serve as fillers and are not scored. Respondents rate each item on a 4-point scale: 0 = strongly disagree, to 4 = strongly agree. Pessimism items are reverse-scored. Higher total scores (maximum = 24) reflect higher degree of optimism.
Personality Trait – Active. A 10-item measure of the personality trait “Activity” from the International Personality Item Pool for Activity9. Participants rate degree to which each statement describes them, ranging from 0 = Very inaccurate to 5 = very accurate. Half the items reflect activity, the other half reflect inactivity. The latter are reverse scored and a higher total score (maximum of 50) reflects a greater degree of activity.
Depressed Mood. The 21-item Beck Depression Inventory 10 assesses symptoms of depression. At Visit 4, an 18 item version was used. Scores at this visit are scaled to the full-length version of the inventory, which was administered at subsequent visits. Higher scores indicate higher level of depressed mood.
Annual Mailer Psychosocial Factors Data
Download Annual Mailer Data Summary Table
Many of the questionnaires on psychosocial factors available at research clinic visits are also available in select Annual Mailers. In addition, data are available on a variety of other psychosocial factors such as stressful life events, memory problems, health insurance, caregiving, resilience, economic decision-making, numeracy, and driving history.
The following standardized inventories and scales, not available at research clinic visits, were included in at least one mailer. See the Annual Mailers Data Summary Table for the timing of each instrument.
Note: Annual Mailer data are available in cross-sectional datasets for each Mailer and are not included in the Psychosocial Factors longitudinal data set. See The Annual Mailers tab for details.
Bem Sex-Role Inventory (BSRI)11. The 30-item BSRI evaluates two distinct categories of personality traits: masculine, with attributes that have been considered more desirable or acceptable for men (eg, aggressive and competitive), and feminine, with attributes that are have been considered more desirable or acceptable for women (eg, nurturing, supportive). Participants rate the degree to which each trait describes them, ranging from 1 = never true, to 7 = always true.
Positive and Negative Affect Scale (PANAS)12. The short form of the PANAS 11 items indicating feelings and emotions over the past week; five reflect a positive affect, 6 reflect a negative affect. Participants indicate the extent to which they felt each emotion in the past week from 1 = very slightly, to 5 = extremely. Scores are derived separately for positive and negative affect.
Perceived Stress Scale 14 (PSS-14)13. The PSS-14 measures how unpredictable, uncontrollable, and overloaded individuals find their life circumstances. Items are rated on a scale ranging from 0 = never, to 4 = very often. Scores are obtained by reverse scoring the positively stated items (#4,5,6,7,9,10,13) and then summing the scores across all 14 items. Higher scores indicate greater perceived stress.
Cook-Medley Hostility Scale14. The 50-item scale measures an individual’s personality and temperament, specifically degree of hostility, using statements from the Minnesota Multiphasic Personality Inventory (MMPI). Participants rate the degree to which the statements apply to them using responses ranging from 1 = always false, to 5 = always true. Higher scores indicate greater hostility/anger and a tendency to distrust and dislike others.
Patient Health Questionnaire-9 (PHQ-9)15. The 9-item depression module of the full PHQ is used to detect and evaluate the severity of depression. Scores for each item range from 0 = not at all, to 3 = nearly every day, and are totaled for the overall score.
Connor-Davidson Resilience Scale (CD-RISC 25)16. The 25-item CD-RISC is designed to measure stress coping ability. Each item is rate on a 5-point scale from 1 = not all true, to 5 = true nearly all the time; higher scores reflect greater resilience.
Duke Health Profile (DUKE)17. The DUKE is a 17-item self-report questionnaire for measuring generic health-related quality of life (HRQOL) during the past week.
Work and Retirement History. Information on current work and retirement history was obtained in 1986 from 5030 participants as part of Annual Mailer 4. This is the primary source of work and retirement information for the RBS cohort.
- Berkman, L. F., & Syme, S. L. (1979). Social networks, host resistance, and mortality: A nine-year follow-up of Alameda county residents. American Journal of Epidemiology, 109, 186–204.
- Fordyce MW. A review of results on the happiness measures: A 60-second index of happiness and mental health. Soc Indic Res. 1988;20:355–81.
- Kaplan RM, Bush JW. Health-related quality of life measurement for evaluation research and policy analysis. Health Psychol 1982;1:61–80.
- Wood V, Wylie ML, Sheafor B. An analysis of a short self-report measure of life satisfaction: Correlation with rater judgements. J Gerontology 1969;24:465-469.
- Diener E, Emmons RA, Larson RJ, Grifin S. The Satisfaction with Life Scale. J Personality Assessment 1985;49:71-75.
- Everson S, Kaplan G, Goldberg D, et al. Hopelessness and four-year progression of carotid atherosclerosis. The Kuopio Ischemic Heart Disease Risk Factor Study. Aterioscler Thromb Vasc Biol. 1997;17:1490–1495
- Bortner RW, Rosenman RH. The measurement of Pattern A behavior. J Chron Dis 20,525,1967
- Scheier MF, Carver CS, Bridges MW. Distinguishing optimism from neuroticism (and trait anxiety, self-mastery, and self-esteem): A re-evaluation of the Life Orientation Test. J Pers Social Psychol 1994;67:1063-1078.
- International Personality Item Pool for Activity. https://ipip.ori.org/
- Beck, A.T., Ward, C. H., Mendelson, M., Mock, J., & Erbaugh, J. (1961) An inventory for measuring depression. Archives of General Psychiatry, 4, 561-571.
- Bem SL. The measurement of psychological androgyny. J Consult Clin Psychol.1974;42:155-162.
- Watson D, Clark LA, Tellegen A. Development and validation of brief measures of positive and negative affect: the PANAS scales. J Pers Soc Psychol, 1988; 54(6), 1063-70.
- Cohen S, Kamarck T, Mermelstein R. A global measure of perceived stress. J Health Soc Behav. 1983;24(4), 385-396.
- Cook WW, Medley DM. Proposed hostility and Pharisaic-virtue scales for the MMPI. J Appl Psychol. 1954;38 (6): 414–418.
- Kroenke K, Spitzer RL, Williams JBW. The PHQ-9: Validity of a brief depression severity measure. J Gen Intern Med. 2001;16(9);606-13.
- Connor KM, Davidson JRT. Development of a new resilience scale: the Connor-Davidson Resilience Scale (CD-RISC). Depress Anxiety. 2003;18(2):76-82.
- Parkerson GR Jr, Broadhead WE, Tse C-KJ. The Duke Health Profile, a 17-item measure of health and dysfunction. Medical Care. 1990;28:1056-1072.