Subjective and objective measures of vision and hearing were obtained at multiple visits; smell was evaluated in the 1994 annual mailer.
Download Vision Data Dictionary
Download Hearing Data Dictionary
Download Smell Data Dictionary
Vision
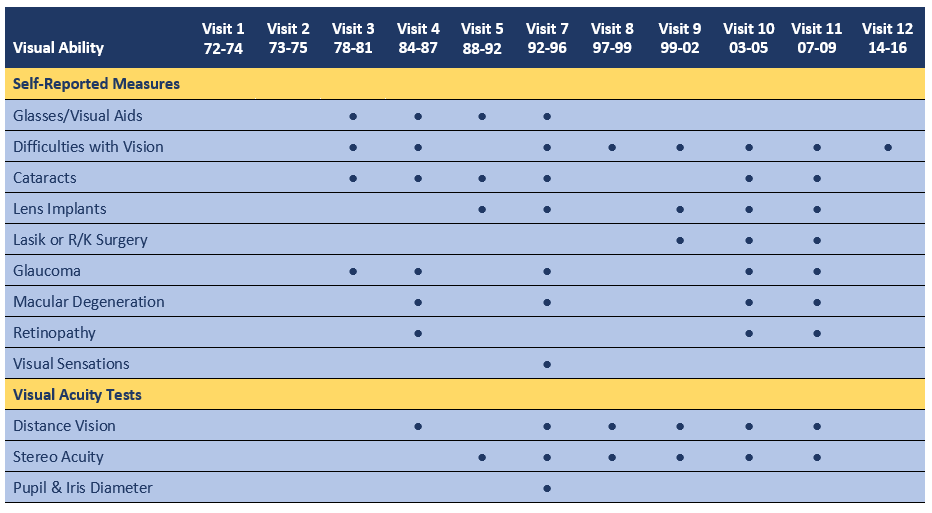
At several visits, participants were asked whether they wore glasses or contact lenses, whether they had difficulties with near or far vision; and whether they had a number of common eye diseases or surgeries. Visual acuity for distance was measured in many visits using the Bailey Lovie eye chart at a distance of 2 meters . The number of letters correctly identified and the corresponding visual acuity (expressed as 20/xxx) are provided. At Visits 5 through 11, stereoacuity was assessed with the Random Dot Circle Stereo test (Stereo Optics, Inc, Chicago, IL).
Bailey IL, Lovie-Kitchin JE. Visual acuity testing. From the laboratory to the clinic. Vision Research,2013; 90: 2-9.
Hearing
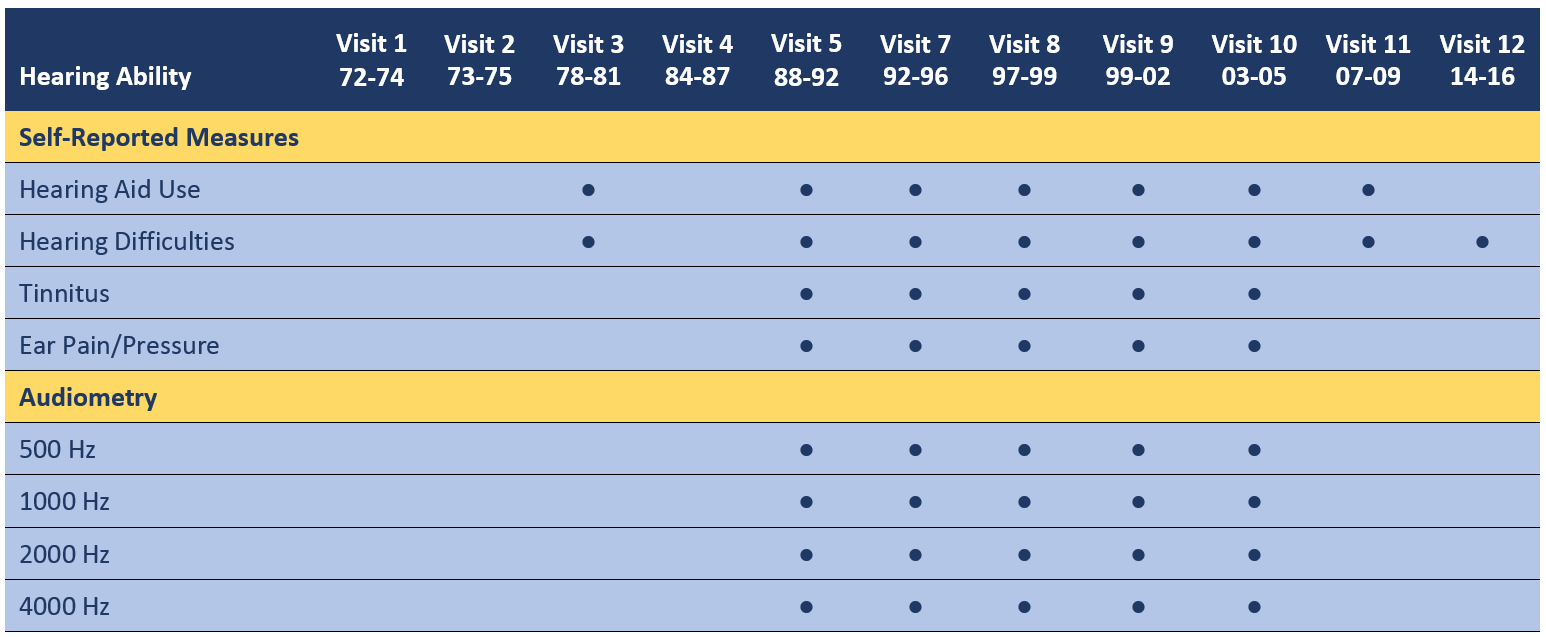
At most visits, participants were asked whether they wore hearing aids, had difficulty hearing normal conversations with or without aids, experienced ringing in the ears (tinnitus) or ear pain or pressure. At Visits 7 through 10, pure tone audiometry was performed with a Welch-Allen portable audiometer in a quiet room. Pure-tone auditory thresholds were measured at frequencies of 500, 1000, 2000, and 4000 Hz in each ear. Participants were tested at sound levels of 40, 25 and 20 dB HL, in that order. Participants were tested at least twice at each frequency and sound level, until two consistent responses were obtained. The lowest level that the participant reported hearing on two trials was recorded as the hearing threshold for that frequency. If a participant was unable to hear the tone at 40 dB HL, a value of 99 was assigned, and testing was stopped. Audiometry was not performed on participants who were wearing a hearing aid. A subset of participants at Visit 5 (the cohort of younger participants; see Research Clinic Visits) also underwent audiometry.
Alattar AA, Bergstrom J, Laughlin GA, Kritz-Silverstein D, Richard EL, Reas ET, Harris JP, Barrett-Connor E, McEvoy LK. Hearing impairment and cognitive decline in older, community-dwelling adults. J Gerontol A Biol Sci Med Sci. 2020;75(3):567-573.
Smell
Download Smell Data Dictionary
Smell was evaluated at a single time point using the National Geographic Smell Survey developed in 1986. Rancho Bernardo Study participants were sent the survey in 1994 as part of the annual mailer (M17). In all, 2244 participants completed and returned the survey. Data from the Smell Survey are included as one of the Sensory Function data groups and are not included in the M17 data file.
The Smell Survey consisted of a questionnaire attached to six scratch-and-sniff panels containing polymer-encased scents. The first part of the questionnaire asked several olfactory-related health questions (e.g. have you ever experienced loss of smell, do you currently smoke tobacco). Participants were then asked to use a coin to scratch and then sniff each panel, to record whether they could smell each odor, and if so, to rate them for their intensity, pleasantness, and other attributes. The six odorants tested were androstenone (sweat), isoamyl acetate (banana), galaxaolide (musk), eugenol (cloves), mercaptans (natural gas) and rose (floral).
Wysocki CJ, Gilbert AN. National Geographic Smell Survey. Effects of age are heterogenous. Ann N Y Acad Sci. 1989;561:12-18.