This spatial project focuses on studying the moviegoing patterns in North Carolina from 1896-1930. However, the project also analyzes the effect that race had on moviegoers and the 1200+ different establishments in North Carolina. The focus is on North Carolina because one-third of the population was African American and urban life was where most movies were shown. The analysis of North Carolina allows there to be a cultural and historical significance to be found in moviegoing. The primary research question is: How did racial differences create different experiences in watching films in urban areas, more specifically the South?
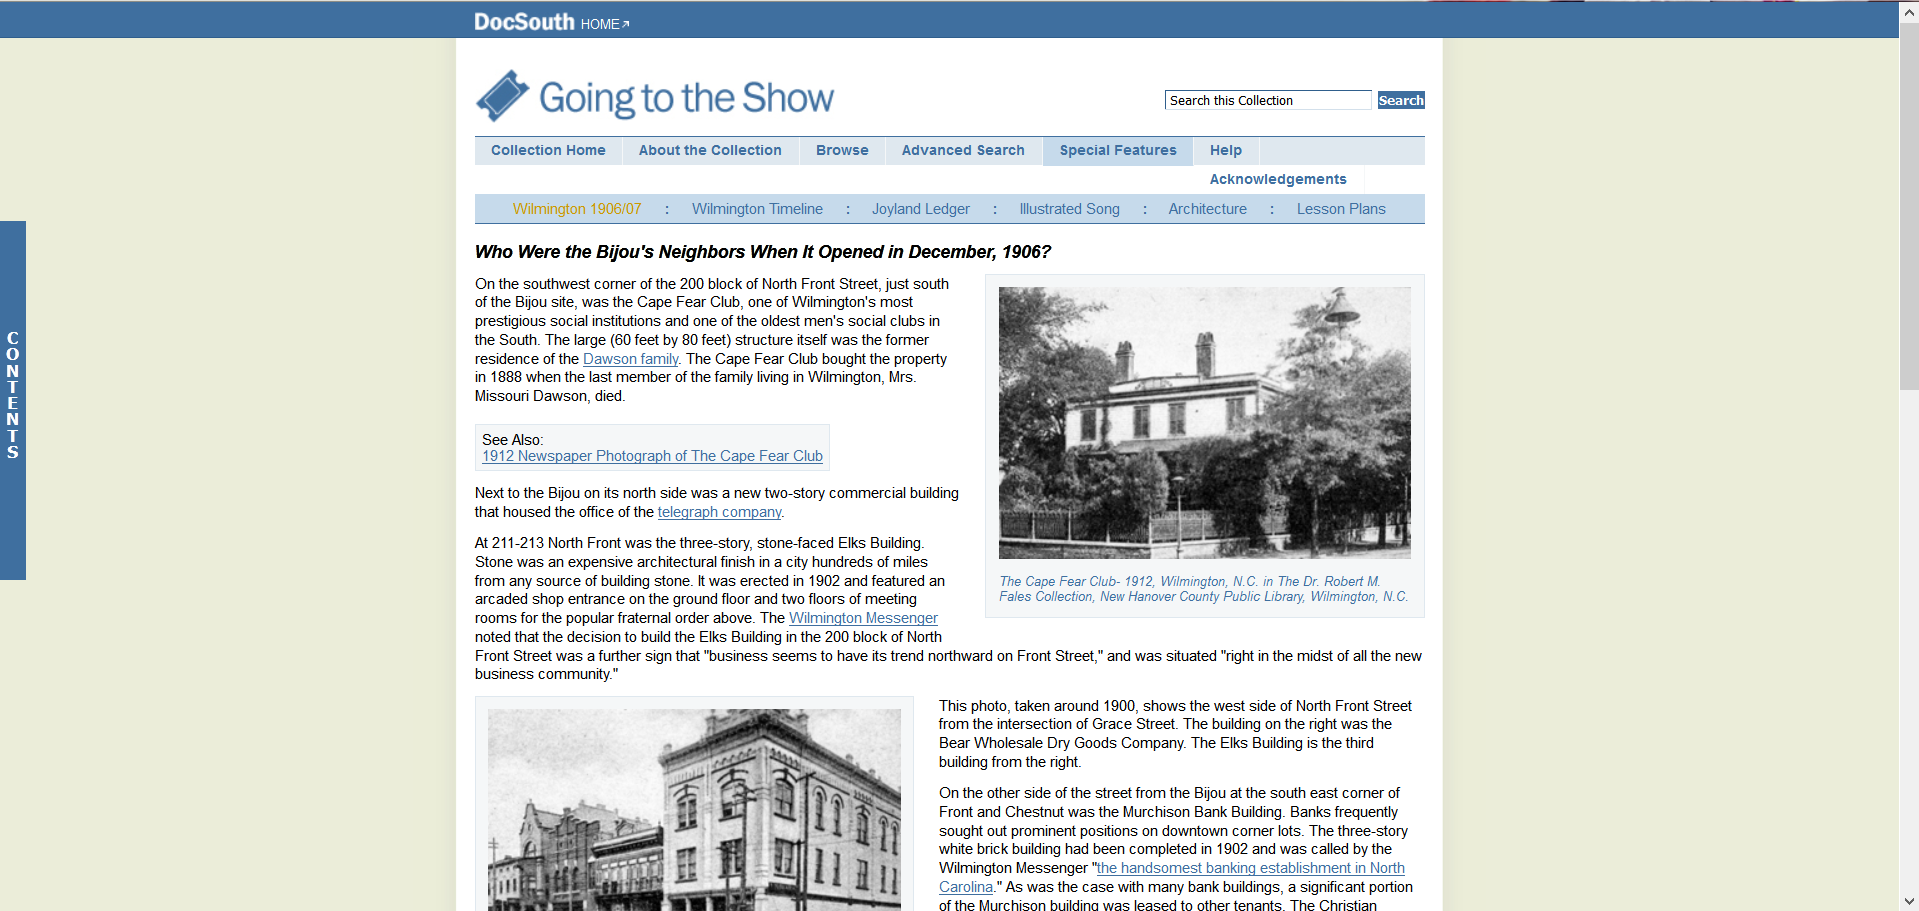
Most of the information and results of the study are labeled poorly which makes it hard to find it. There are randomly placed hyperlinks that lead to different pages of the site, but also take you to external pages within the same tab. The important information is featured in Special Features and has different sections that include a timeline (very challenging to navigate through) The project sheds new light on the experience of moviegoers while taking race into account. Most theatres were segregated and were known as black theaters. There is a map that list the different theaters but seems to be outdated. The google map is unable to load properly and has overlays that take away from the learning experience. The layout of the website is simple, yet cluttered. The similar blue colors throughout the project make it hard to find certain things. Although the labels are along the top, there is no clear distinction between any visual aids or more textual information. When reading the special features tab, I was trying to find more subsections about the cultural and social effects of moviegoing in North Carolina. I had to stumble across the thin blue sidebar labeled “contents” to find more info. The site does have great info on the moviegoing activities of people in North Carolina, but it uses outdated technologies.
The mapping software references Google Earth, which is the older term for google maps. This makes it hard to find information on the theaters through the map. There is also a timeline of the theater’s existences, but it is a jumbled mess. The technologies used to create the timeline were very simple and make it hard to know how to navigate through it. I would use more contrasting colors for the site and a better outline for the tabs and info. You can label visual aids in one tab where the maps and timelines are. Then the other labels can consist of textual info and pictures accompanying the info. A lot of the theatres don’t have any information when looking for more context on the theatre. I would have linked the theaters to the textual info under special features to add a historical context to it. Overall, the website successfully provides an in-depth analysis of the cultural differences in moviegoing from 1896 and so on. However, the website is poorly organized, and the technologies used are outdated, so they don’t load properly. The search feature is the most organized and is more helpful in finding information on theaters in specific towns or cities.