Children were selected for participation in this cohort study with the objective of enrolling an approximately balanced distribution of those who lived with a flower plantation worker, and those who did not live with agricultural workers and had no known direct pesticide exposures.
10 additional follow-up examinations have been conducted between 2022-2024 (FUY-14a to FUY16d)
| Participant Characteristics | Follow-up year (FUY) | ||||
| Baseline (2008, Jul-Aug) | FUY-8a (2016, April) | FUY-8b (2016, Jul-Oct) | FUY 14a (2022, Jul-Sep) | FUY14b, 15a, 15b, 15c, 15d, 16a, 16b, 16c, 16d | |
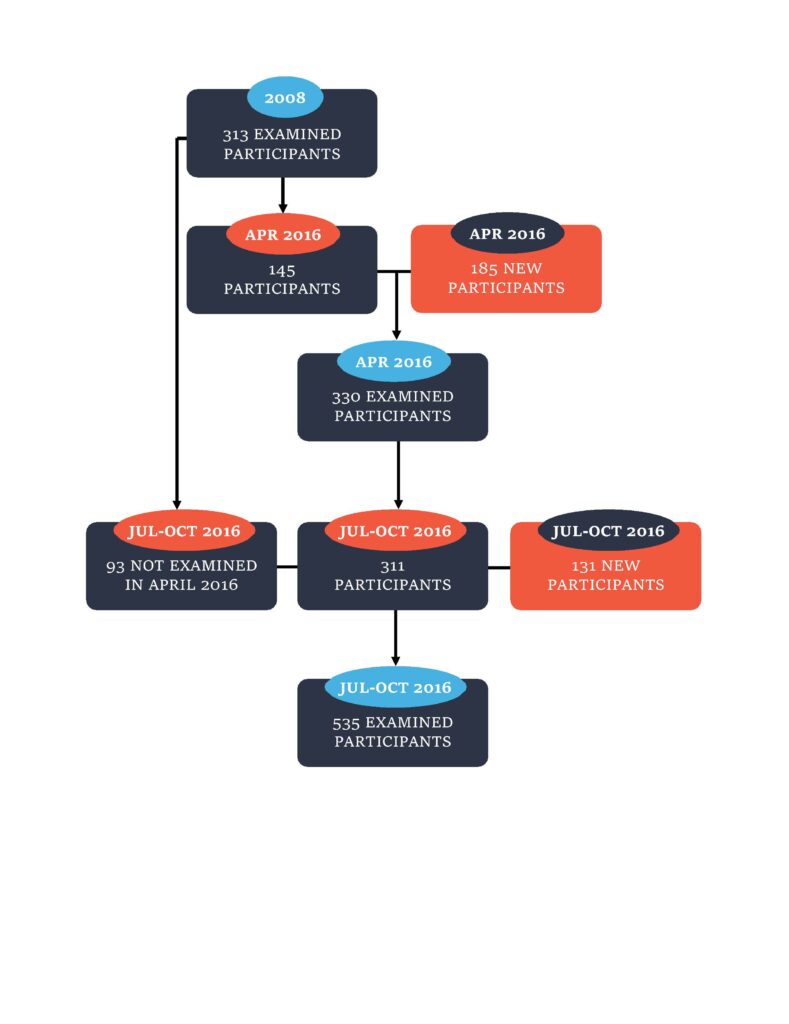
| N | 313 | 330 | 535 | 505 | |
| Age, Years | 6.6 (1.6) | 14.3 (1.9) | 14.5 (1.8) | ||
| Male | 51% | 51% | 50% | ||
| Female | 49% | 49% | 50% | ||
| Indigenous | 21% | 24% | 22% | ||
| Mixed | 77% | 76% | 78% | ||
| Other Race | 2% | 1% | 0% | ||
| BMI-for-age Z-Score, SD | 16.1 (1.4) | 20.8 (3.0) | 20.9 (3.0) | ||
| Height-for-age Z-Score, SD | 112.1 (10.3) | 148.9 (9.7) | 150.6 (9.4) | ||
| Lives with agriculture worker | 57% | 68% | 67% | ||
| Doesn’t live with agricultural worker | 43% | 32% | 33% | ||
| Distance from house to nearest flower plantation, m | 346 (178-600) | 311 (112-655) | 311 (111-659) |
Exam 1 = Summer, 2008, Exam 2 = April, 2016, Exam 3 = Summer, 2016.