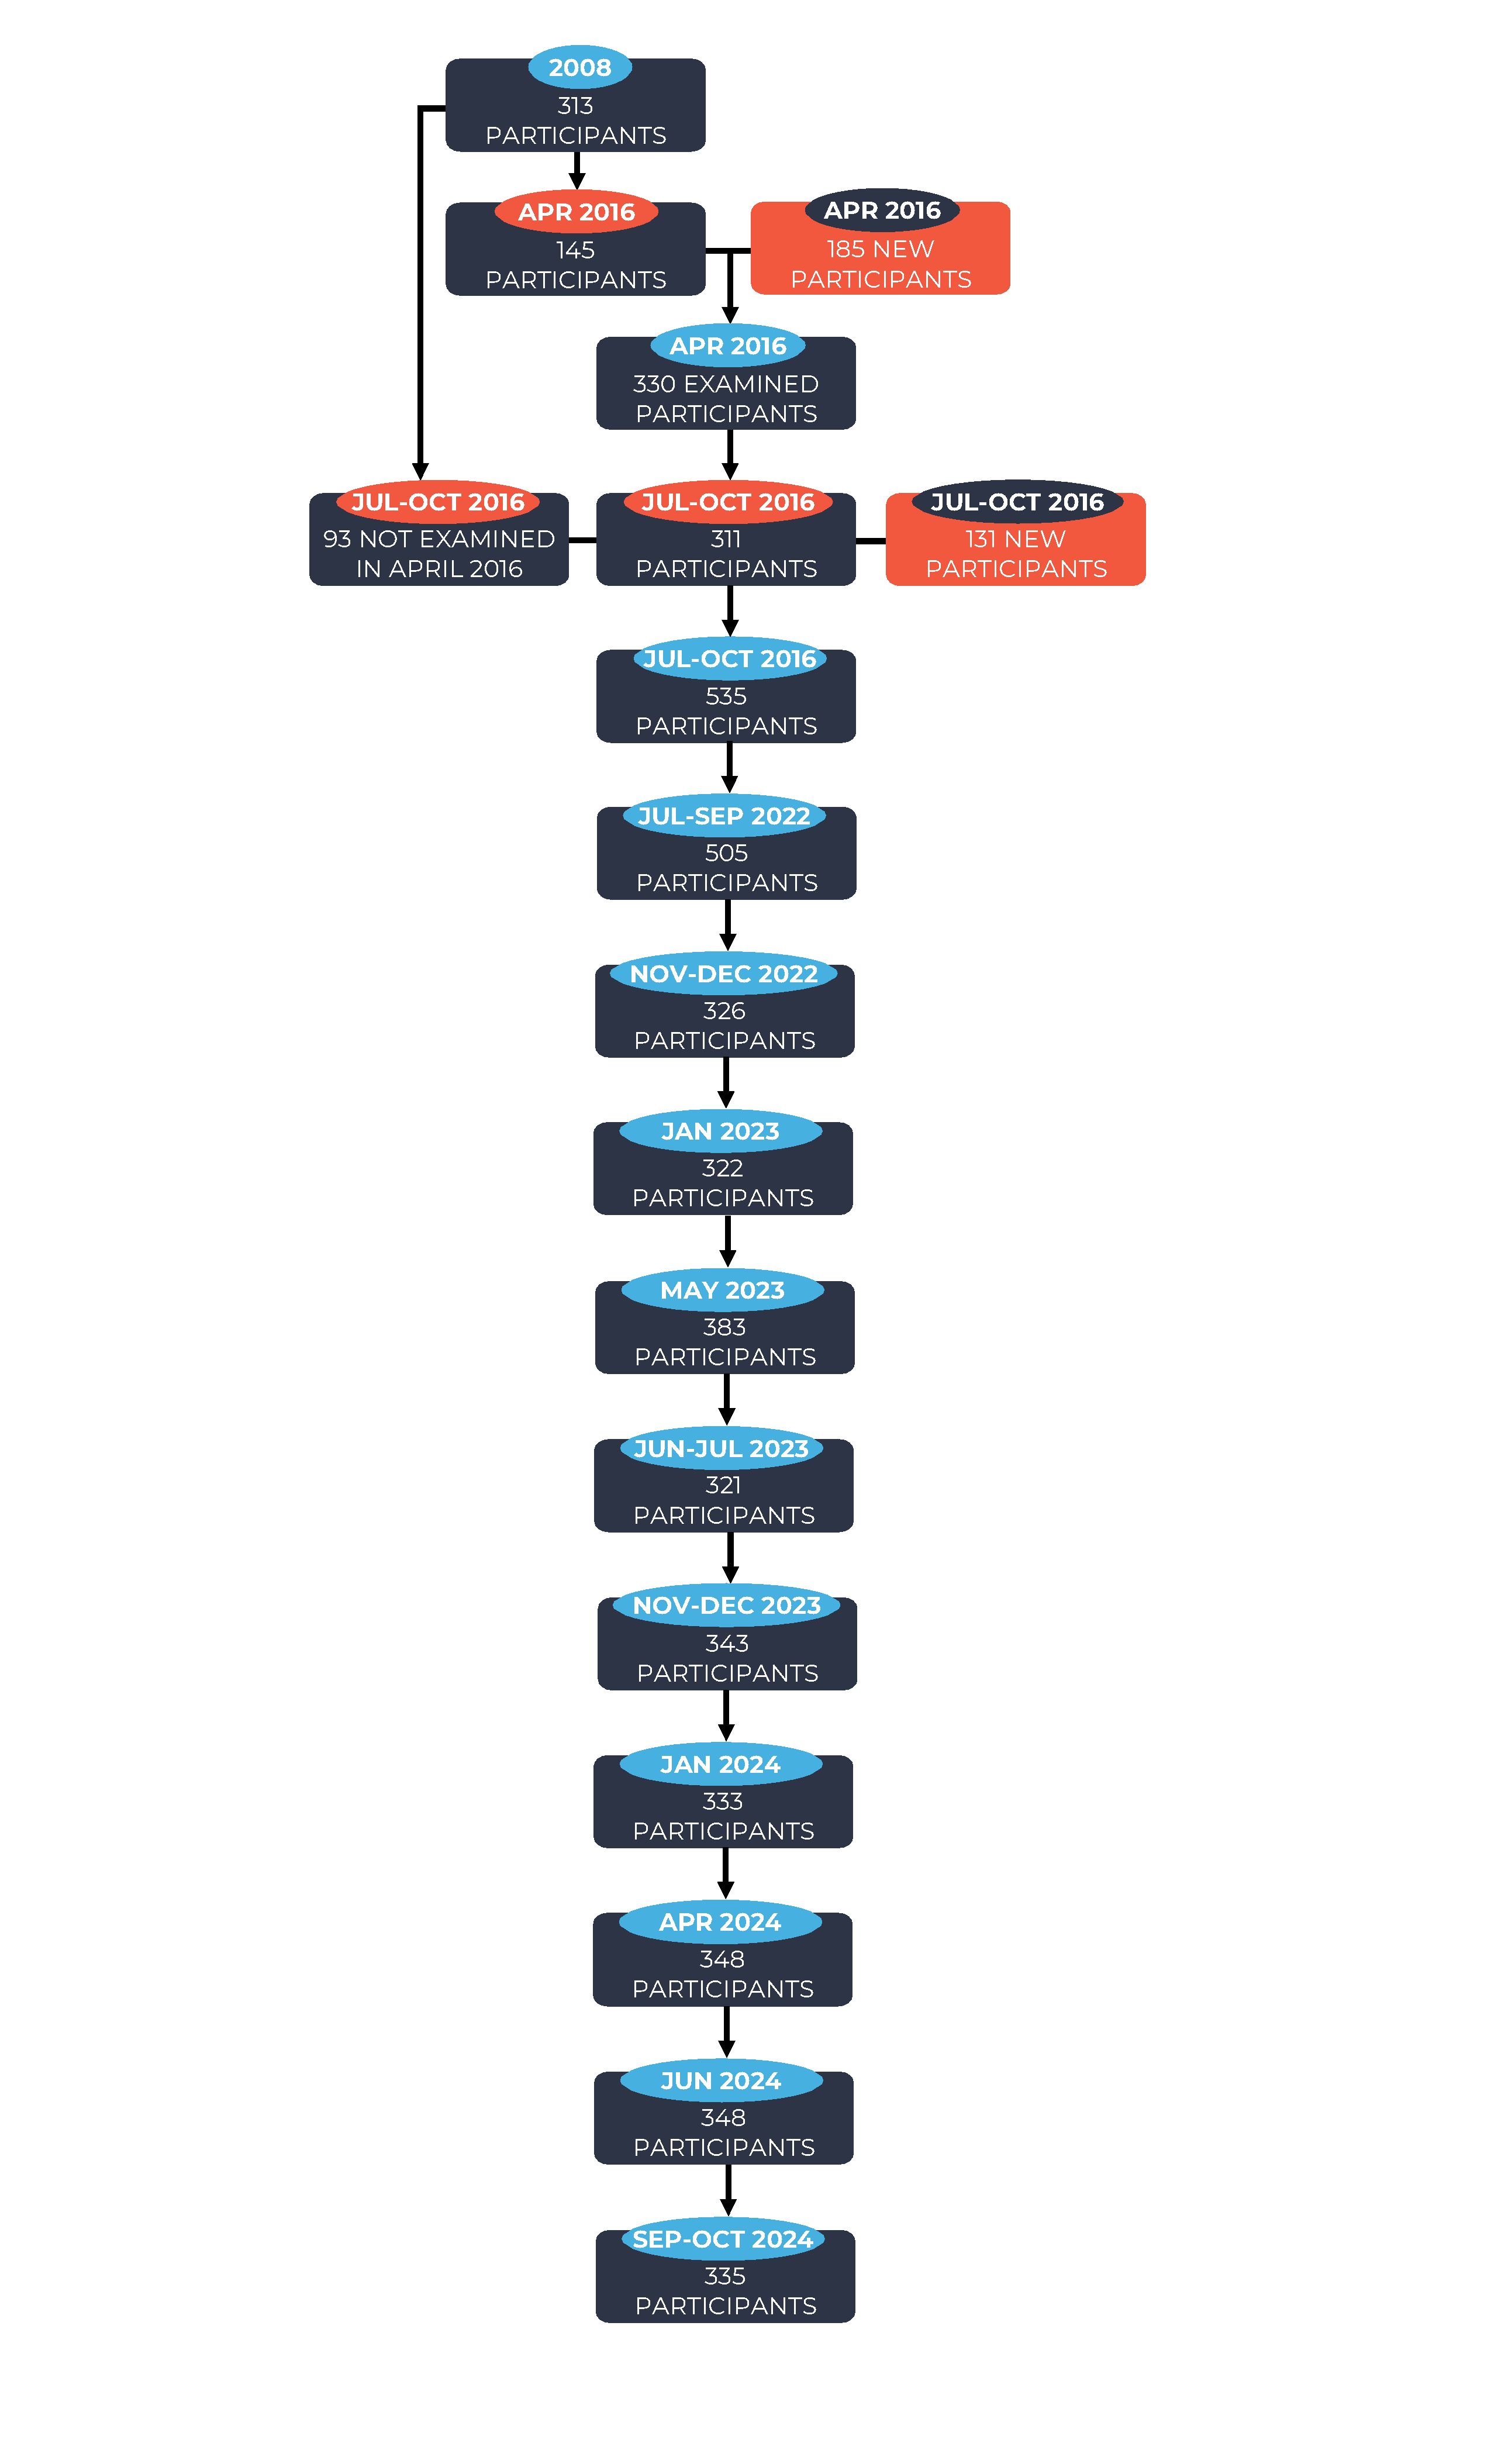
Children were selected for participation in this cohort study with the objective of enrolling an approximately balanced distribution of those who lived with a flower plantation worker, and those who did not live with agricultural workers and had no known direct pesticide exposures. Below is the participant flow chart of participants examined in the ESPINA study since 2008.
| Participant Characteristics | Follow-up year (FUY) | ||
| Baseline (2008, Jul-Aug) | FUY-8a (2016, April) | FUY-8b (2016, Jul-Oct) | |
| N | 313 | 330 | 535 |
| Age, Years | 6.6 (1.6) | 14.3 (1.9) | 14.5 (1.8) |
| Male | 51% | 51% | 50% |
| Female | 49% | 49% | 50% |
| Indigenous | 21% | 24% | 22% |
| Mixed | 77% | 76% | 78% |
| Other Race | 2% | 1% | 0% |
| Lives with agriculture worker | 57% | 68% | 67% |
Exam 1 = Summer, 2008, Exam 2 = April, 2016, Exam 3 = Summer, 2016.